
Enterprise Performance & Load Testing Services in Bangalore
We stress-test web applications, microservices, and databases against massive traffic surges. Identify memory leaks, CPU bottlenecks, and query locks with JMeter, k6, and distributed cloud load generators before production launches.
Complete Performance Engineering Capabilities
Simulating extreme user loads to guarantee zero downtime during traffic spikes.
Load & Capacity Testing
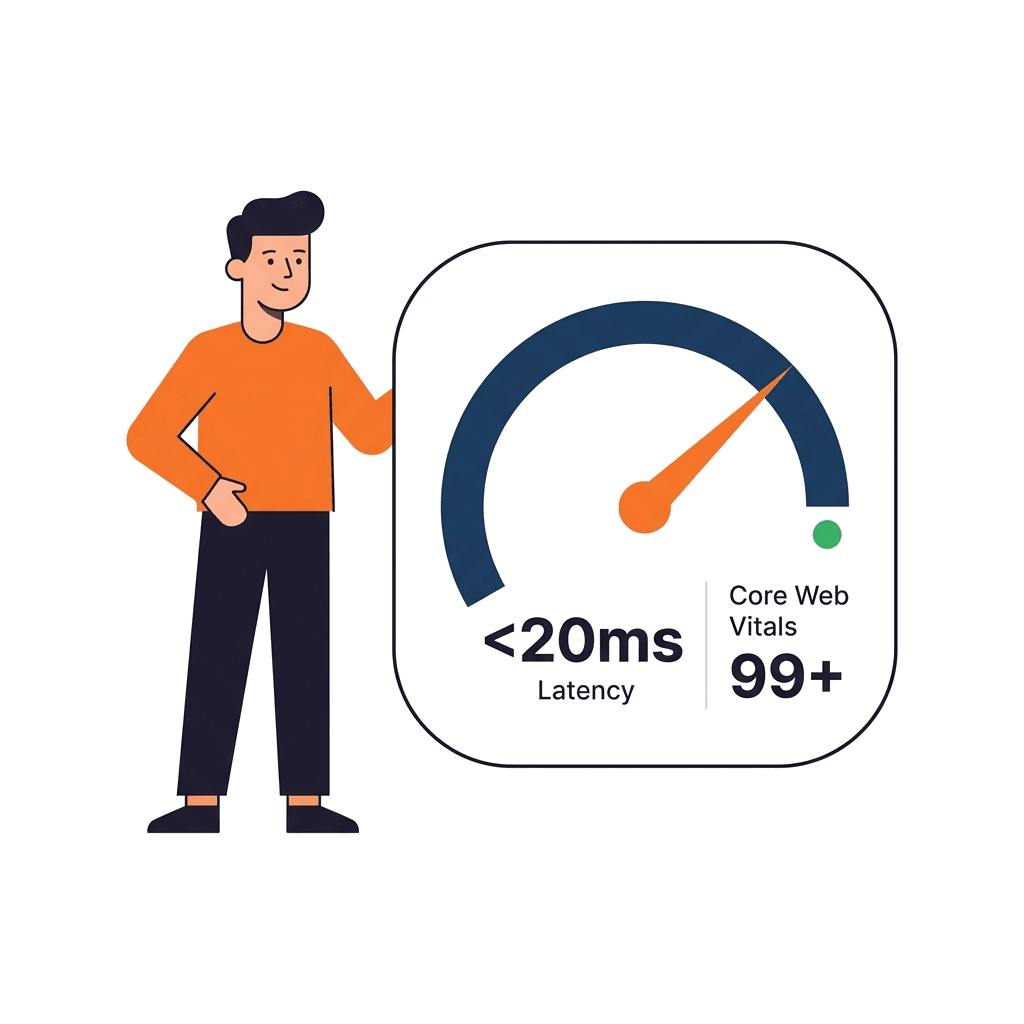
Simulating expected peak concurrent user volumes to measure throughput (RPS), server resource utilization, and baseline response latencies.
Explore Load & Capacity Testing
Extreme Stress & Breaking Point Testing
Pushing applications beyond designed limits to discover exact breaking points, failover behavior, and graceful degradation mechanics.
Explore Extreme Stress & Breaking Point Testing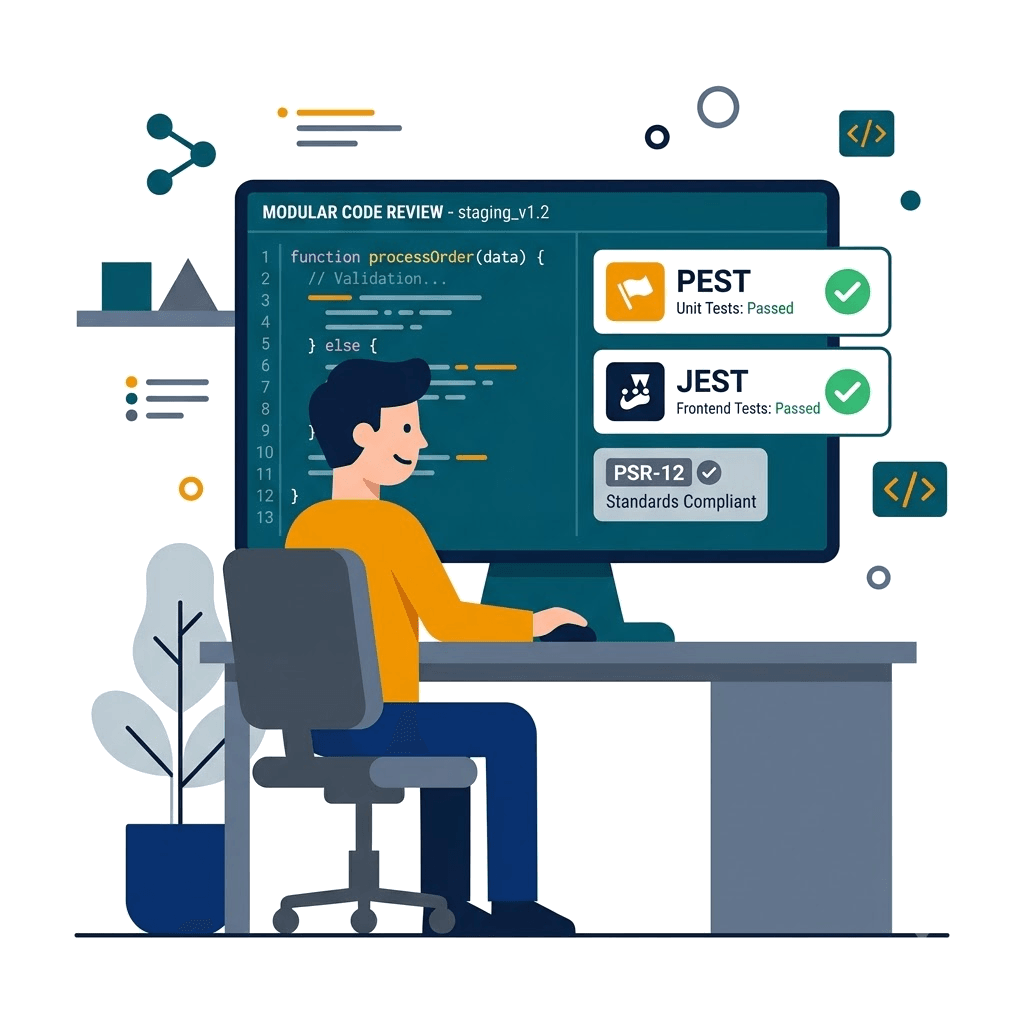
Endurance & Soak Testing
Running sustained medium-to-high loads over 12 to 48 hours to uncover slow memory leaks, disk fill-ups, and thread exhaustion.
Explore Endurance & Soak Testing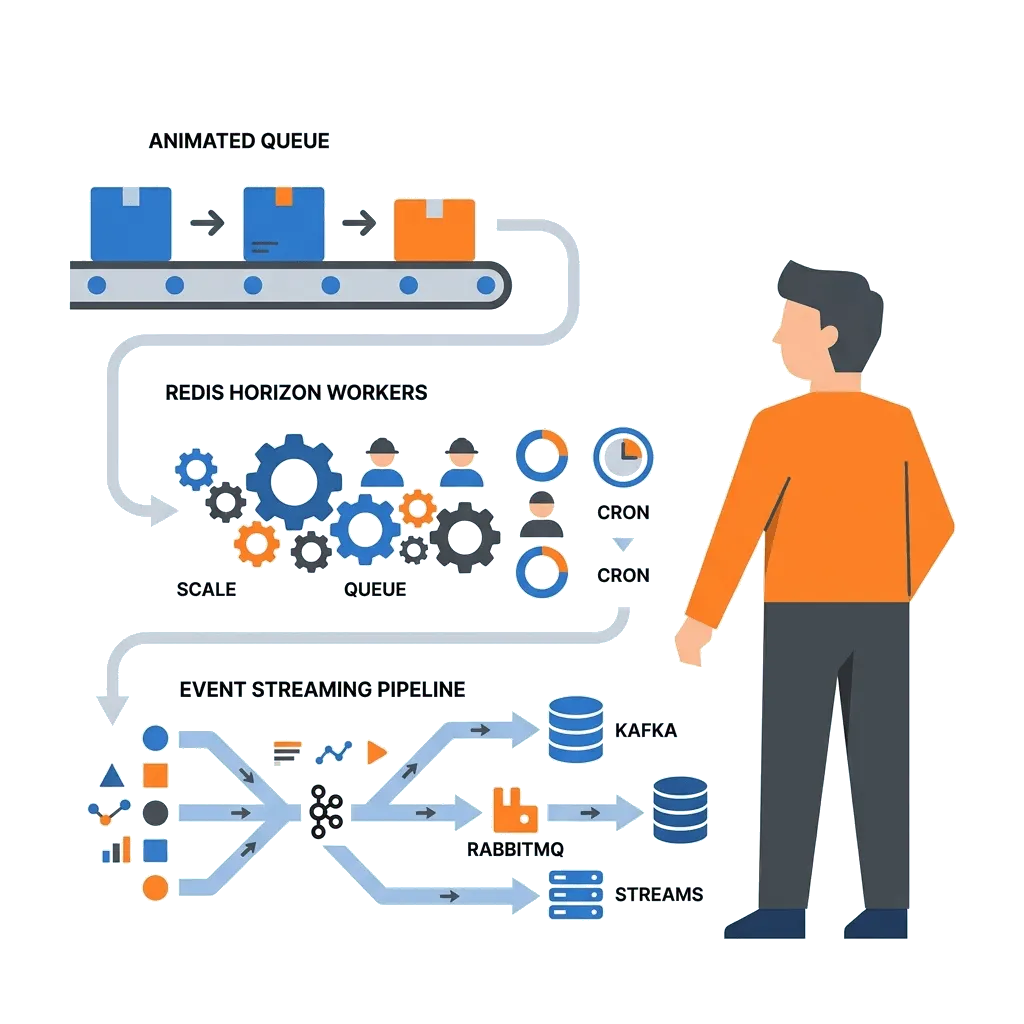
Spike & Flash Crowd Testing
Simulating sudden 10x traffic spikes within seconds (such as flash sales or marketing campaigns) to validate autoscaling responsiveness.
Explore Spike & Flash Crowd Testing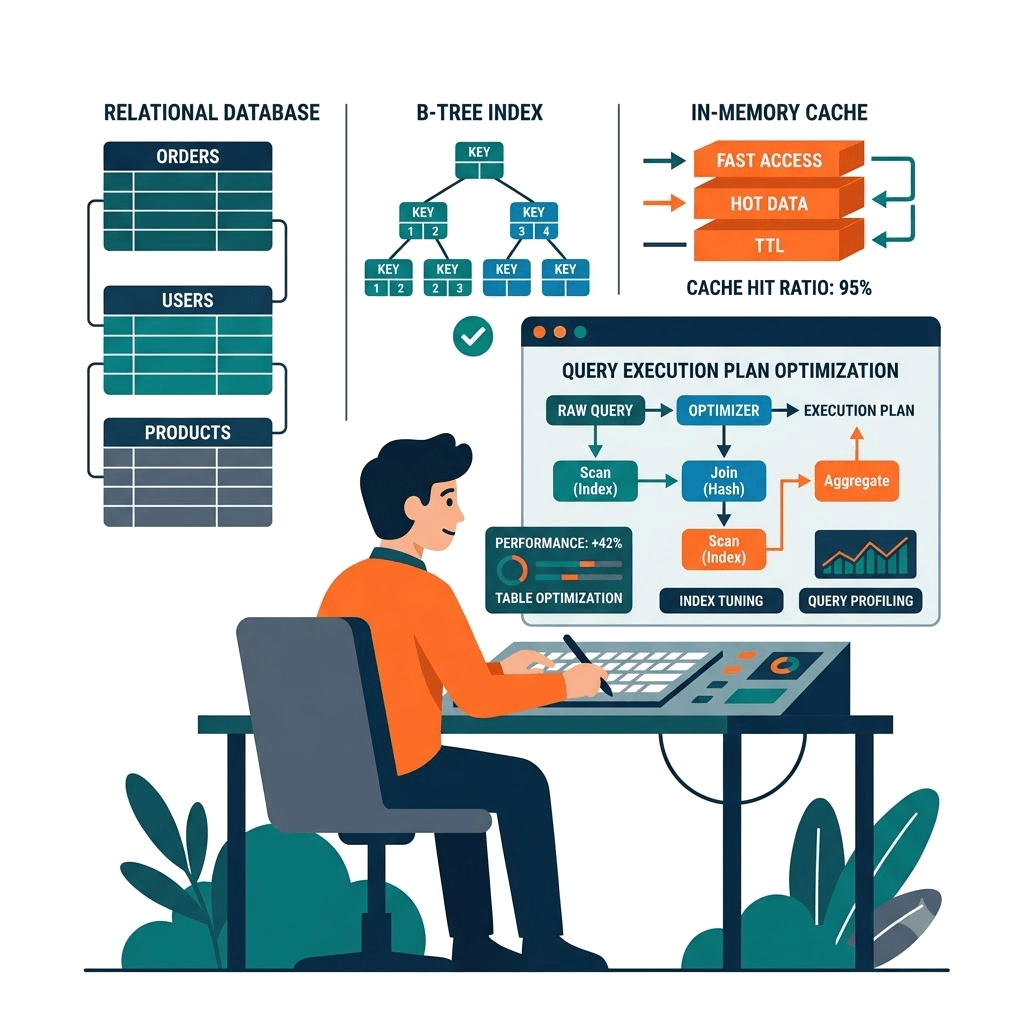
Database Query & Lock Profiling
Analyzing slow SQL query execution plans, connection pool contention, unindexed joins, and locking deadlocks under heavy write loads.
Explore Database Query & Lock Profiling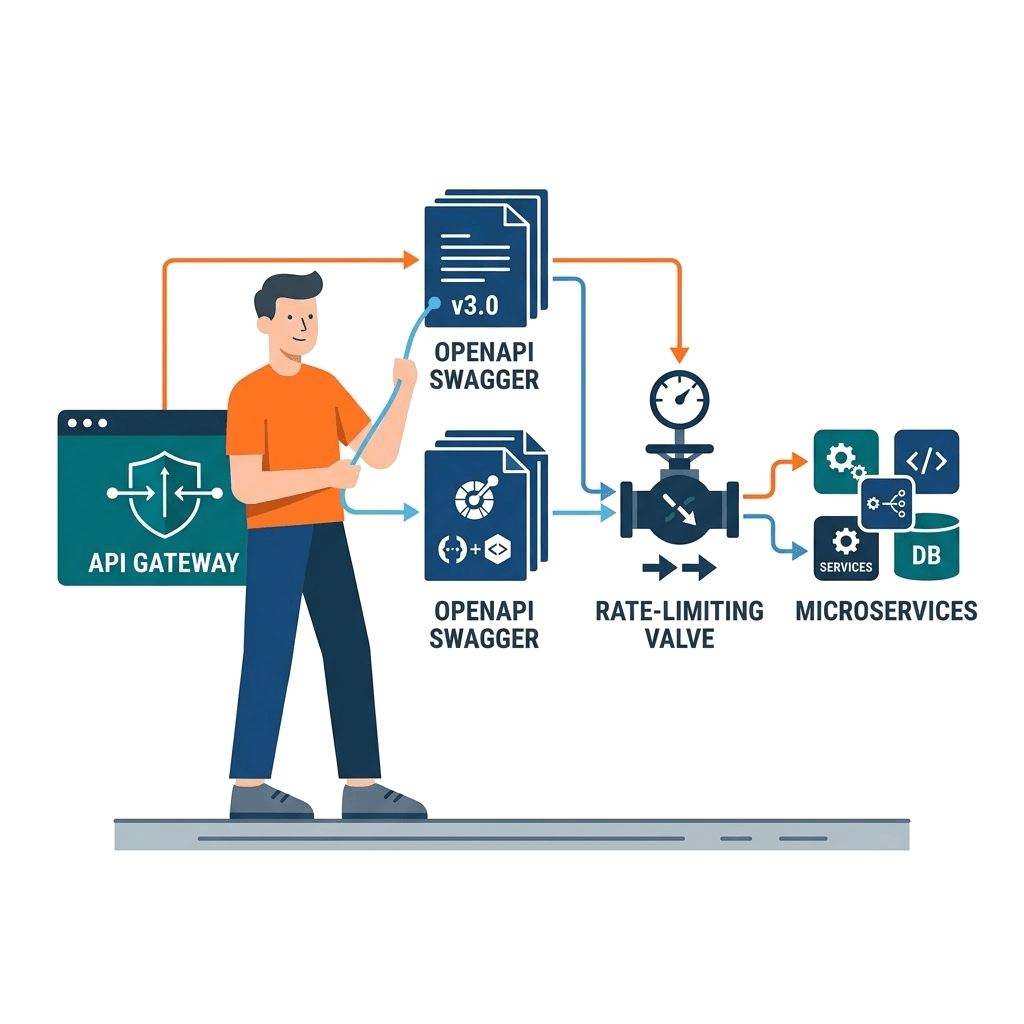
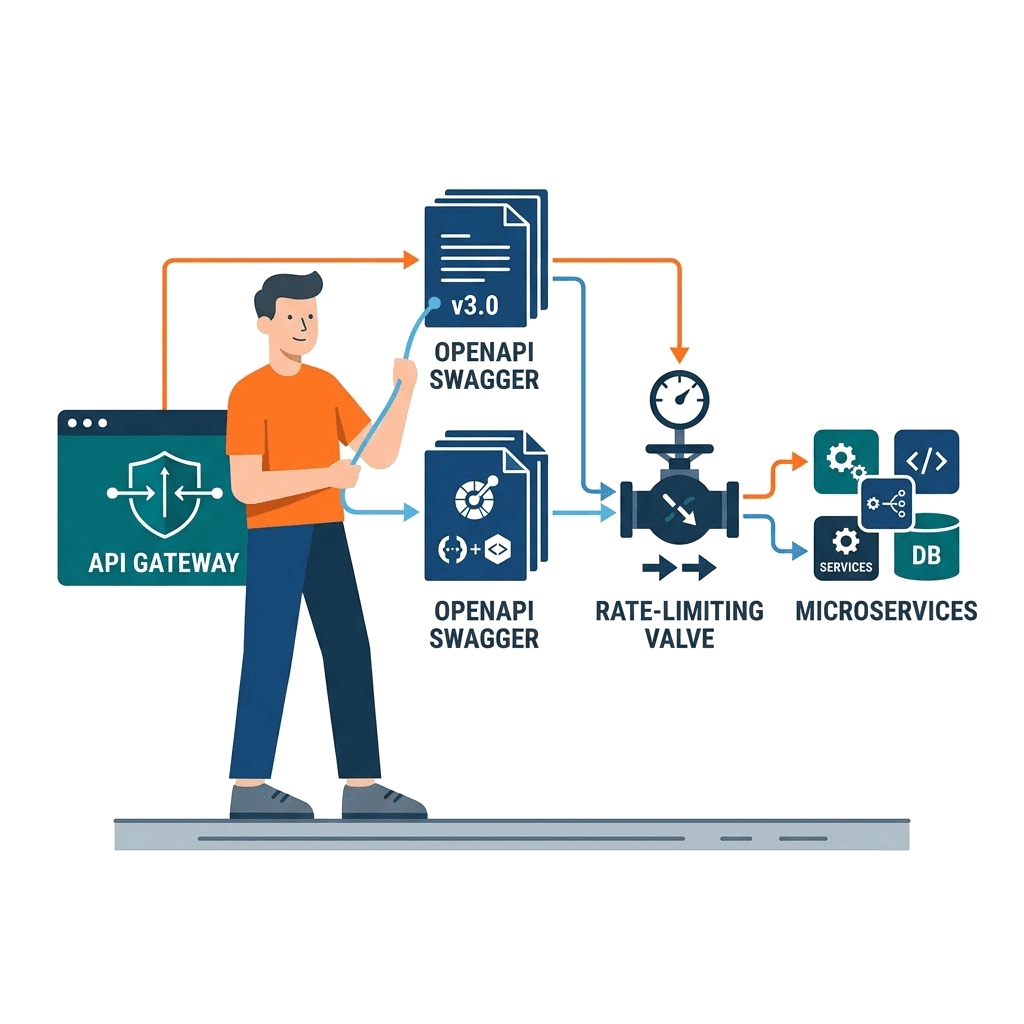
API & Microservices Latency Profiling
Benchmarking REST and gRPC endpoint latencies under load with distributed tracing through Jaeger, Datadog, and New Relic.
Explore API & Microservices Latency ProfilingOur Performance Testing Toolset
Modern load injection tools, cloud generators, and application telemetry.
Load Generators
Cloud Injection Grids
APM & Telemetry
Database Profiling
Our Performance Testing Lifecycle
A 6-step rigorous engineering process from SLA modeling to bottleneck remediation.
Non-Functional Requirements (NFR) Scoping
Defining target TPS (transactions/sec), 95th/99th percentile response times, and concurrency targets.
Test Scenario Modeling & Data Setup
Constructing realistic test scripts with randomized payloads, session cookies, and database seed records.
Environment Isolation & Baseline Runs
Executing single-user baseline tests to verify clean telemetry and capture baseline response latencies.
Distributed Load Execution
Gradually ramping virtual users across distributed cloud nodes while monitoring server CPU, RAM, and I/O.
Deep Telemetry & Bottleneck Isolation
Identifying thread contention, database slow queries, memory leaks, and network socket limits.
Tuning Recommendations & Retesting
Delivering concrete optimization patches (caching, query indexing, pool tuning) and running verification tests.
Enterprise Performance Standards
Engineering high-resilience systems capable of handling unprecedented spikes.
p95 Response Time < 300ms
Enforcing that 95% of all transactional requests complete within 300ms under full designed load.
Zero Error Rate Under Peak Load
Strict requirement of 0.00% HTTP 5xx errors during sustained peak concurrency testing.
Graceful Autoscaling Verification
Verifying container orchestration scales pods from 5 to 50 within 90 seconds without dropping sessions.
Database Pool Non-Exhaustion
Ensuring connection pool queues never exceed 80% utilization during flash crowd load spikes.
Zero Memory Leak Resilience
Confirming memory garbage collection returns to baseline following 24-hour soak tests.
Fault-Tolerant Circuit Breaking
Validating that downstream third-party service latency triggers circuit breakers without crashing the app.
Featured Performance Testing Case Study
Stress-testing an e-commerce platform ahead of annual festive flash sales.
150,000 Concurrent User Load Simulation for E-Commerce Giant
Simulated 150,000 simultaneous users across distributed k6 cloud nodes for a major retail platform. Uncovered critical Redis locking bottlenecks and database deadlock issues, enabling optimization that handled record-breaking flash sale traffic with 100% uptime.
Why Partner With Render Infotech?
Over 16+ years and 500+ successful deployments, we have established an engineering reputation in Bangalore for technical rigor, architectural transparency, and zero compromise on code quality.
- Dedicated In-House Engineers: Direct communication with senior specialists, not junior offshore intermediaries.
- 100% IP & Code Ownership: Full source code, database structures, and copyright ownership transferred upon milestone sign-off.
- Performance SLA Guarantee: Contractually committed speed benchmarks, security verification, and high-availability SLAs.
- Transparent Weekly Sprints: Live staging environments, progress demos, and clear milestone accounting.
Enterprise Performance Commitment
Every project we engineer is guaranteed to pass rigorous vulnerability scans, mobile responsiveness checks, and automated regression testing prior to production launch.
Bangalore Engineering Center
Kalyan Nagar, Bengaluru — Local Support & Global Standards
Performance & Load Testing Services FAQs
Answers to common technical, pricing, and timeline questions regarding our Performance & Load Testing Services services.
Ready to Architect Your Solution?
Connect directly with our senior technical architects in Bangalore for an architectural consultation, technology recommendation, and formal scope estimate within 24 hours.
Request a Performance & Load Testing Services Proposal
Fill out your technical brief below to receive an architectural estimate within 24 hours.