
Turn Data into Strategy: Data Analytics & BI Services in Bangalore
We design high-impact executive dashboards and self-service business intelligence systems that turn raw enterprise data into clear visual insights. Empower decision-makers with real-time KPIs across Power BI, Tableau, and Looker.

Complete Data Analytics & BI Capabilities
Delivering intuitive visual analytics that replace static spreadsheets with real-time operational truth.
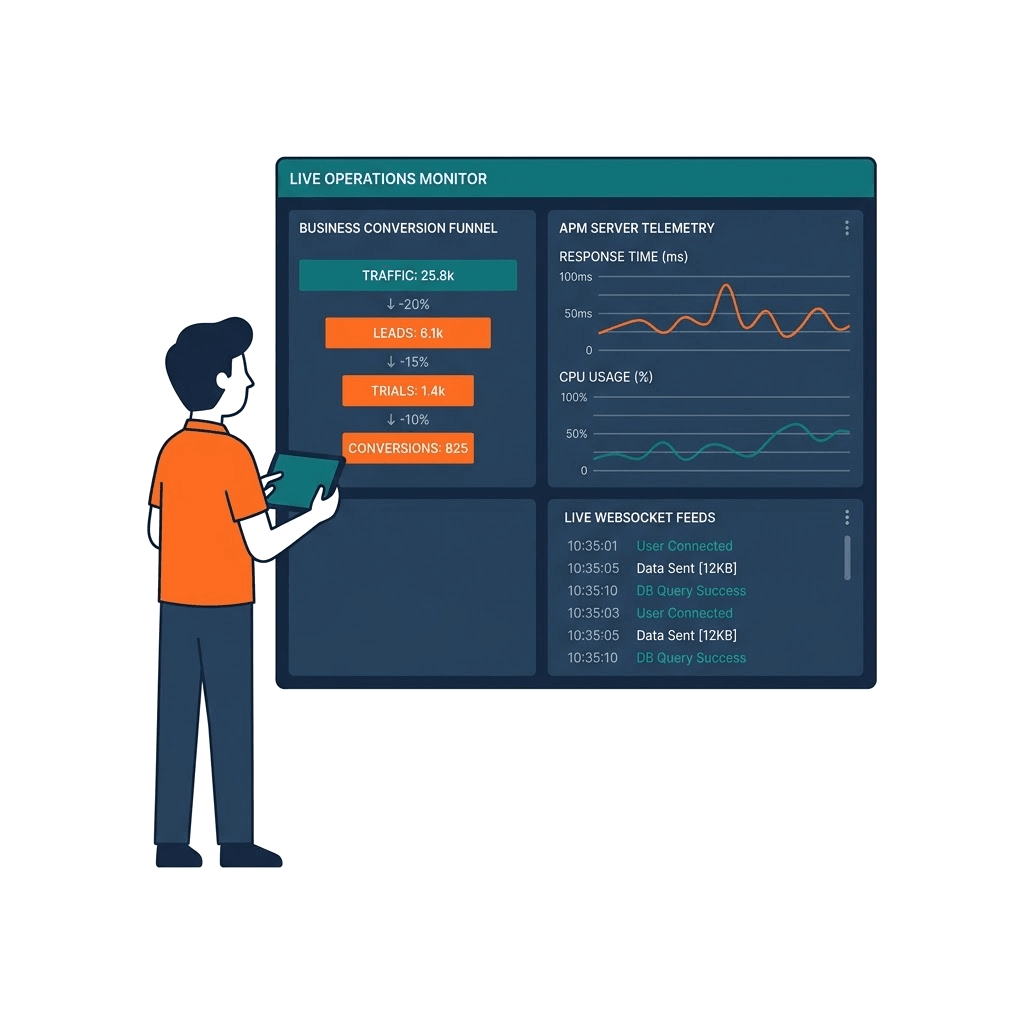
Executive & Operational Dashboard Design
Designing tailored C-suite executive scorecards, sales pipeline tracking, financial P&L views, and operational efficiency dashboards.
Explore Executive & Operational Dashboard Design
Power BI Enterprise Implementation
Building scalable DAX calculations, tabular semantic data models, row-level security (RLS), and scheduled gateway data refreshes.
Explore Power BI Enterprise Implementation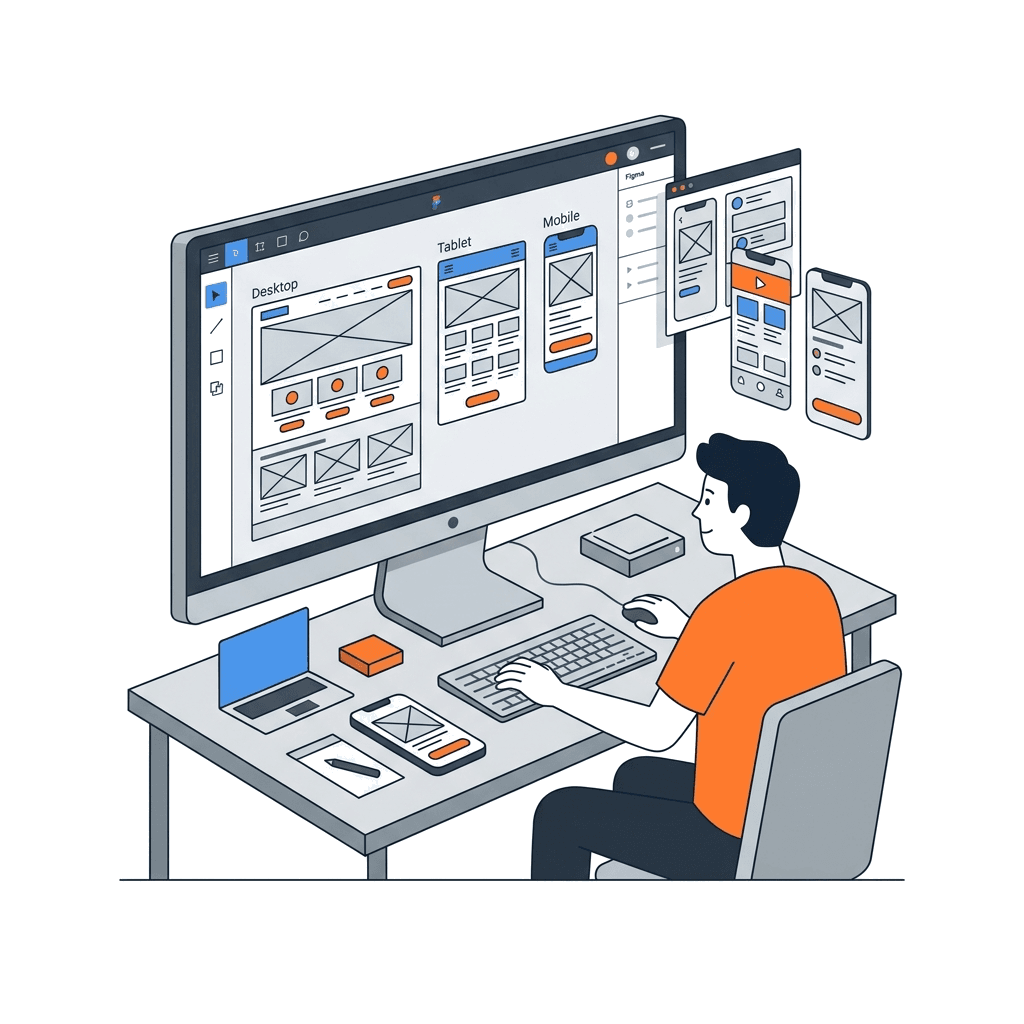
Tableau Visual Storytelling & Analytics
Interactive visual exploratory reports, Level of Detail (LOD) expressions, parameter actions, and custom data storytelling.
Explore Tableau Visual Storytelling & Analytics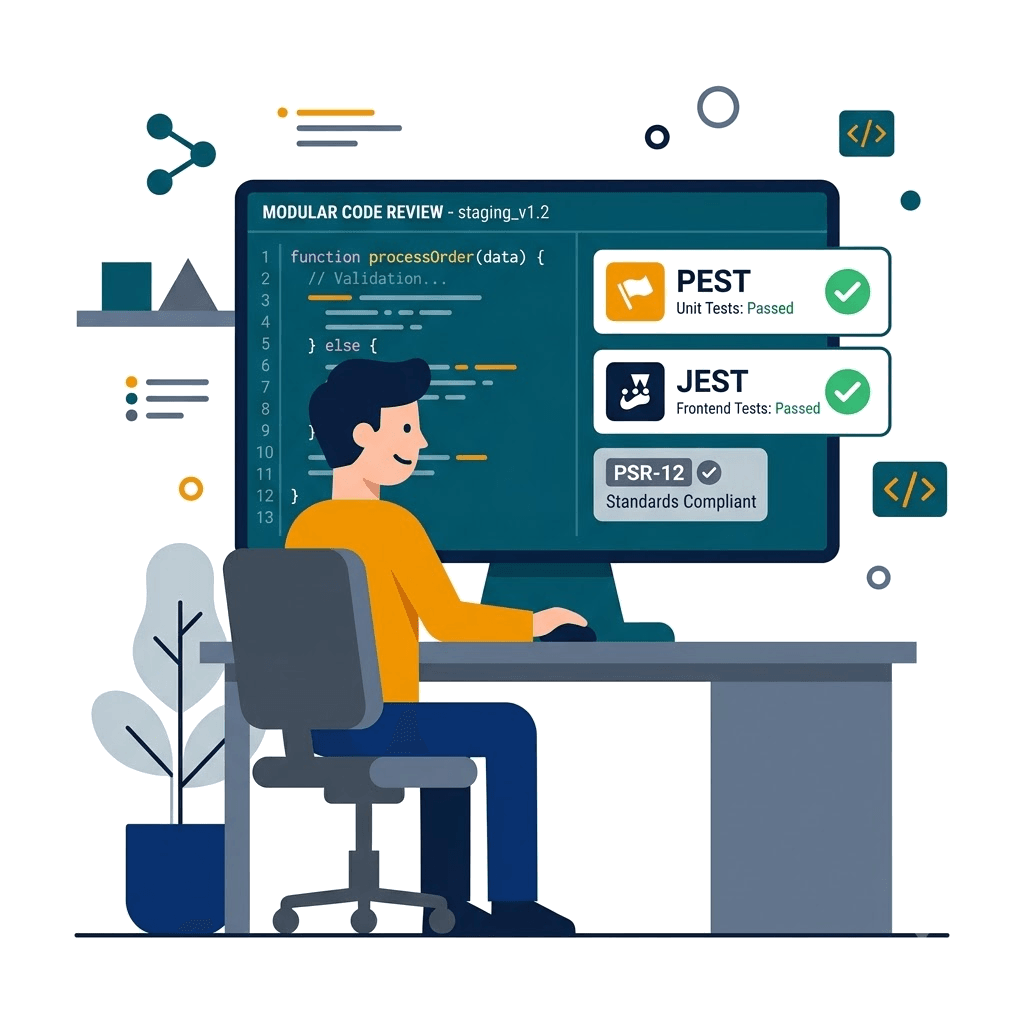
Looker & LookML Semantic Architecture
Centralized metric definitions, reusable LookML dimensions and measures, and automated data delivery scheduled to email and Slack.
Explore Looker & LookML Semantic Architecture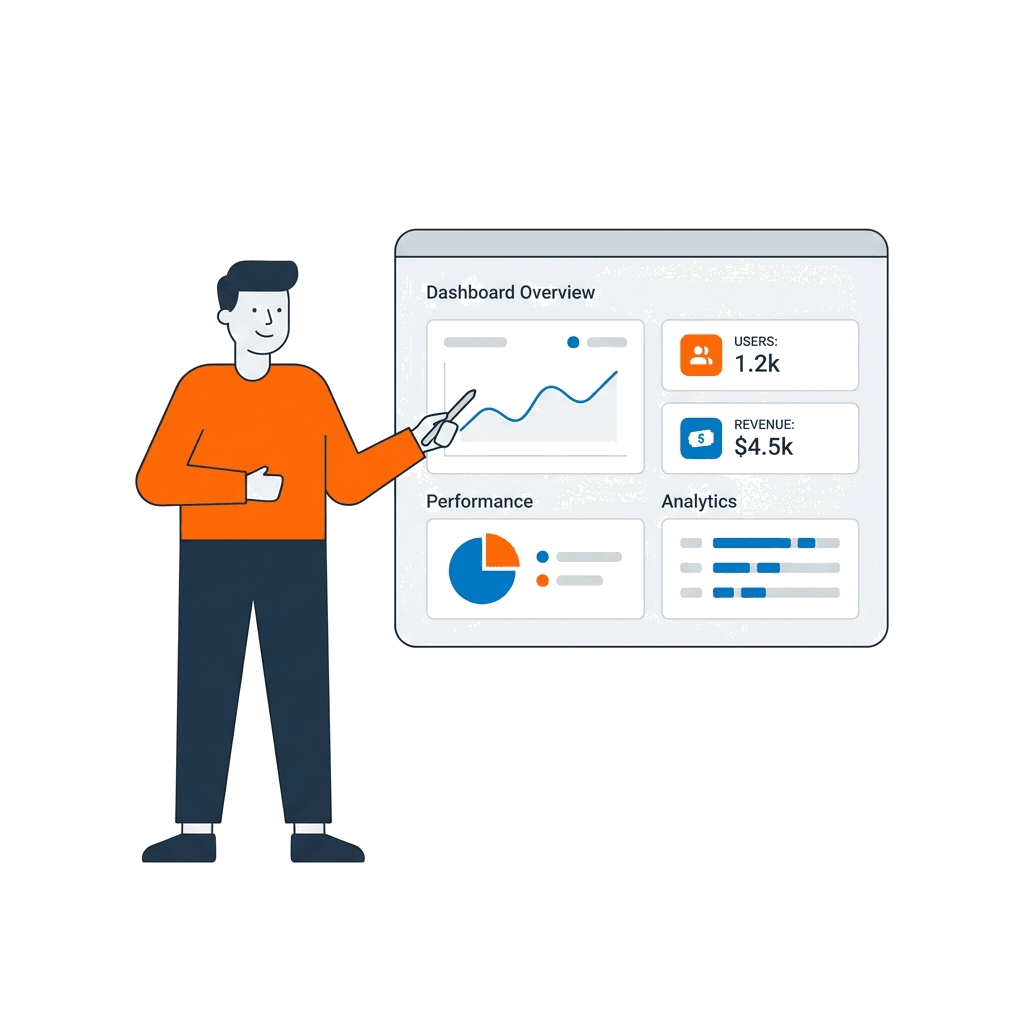
Self-Service BI & Semantic Layer Setup
Empowering non-technical business users to build drag-and-drop reports safely without writing SQL queries or breaking production data.
Explore Self-Service BI & Semantic Layer Setup
Row-Level Security (RLS) & Governance
Enforcing dynamic role-based data security ensuring branch managers and sales reps view only data pertinent to their jurisdiction.
Explore Row-Level Security (RLS) & GovernanceOur Business Intelligence Stack
Industry-standard BI tools, calculation engines, and semantic layers.
BI Platforms
Calculation & Semantic
Cloud Data Sources
Security & Distribution
Our BI Implementation Lifecycle
A collaborative 6-stage development process delivering actionable business dashboards.
KPI Scoping & Executive Persona Mapping
Interviewing C-level executives and managers to define key decision-making metrics, targets, and drilldowns.
Data Source & Semantic Architecture
Connecting warehouse sources, defining star schema relationships, and establishing conformed dimensions.
Wireframing & Visual UX Layout
Designing intuitive dashboard layouts in Figma focusing on visual hierarchy, color theory, and mobile responsiveness.
DAX / Calculation & Report Build
Developing optimized measures, time-intelligence calculations (YoY, MoM, YTD), and dynamic KPI cards.
Row-Level Security & Performance Tuning
Enforcing role-based data security filters and optimizing visual queries to render under 3 seconds.
User Training & Self-Service Handoff
Conducting training workshops for business users and delivering complete semantic model documentation.
Enterprise BI Standards
High-speed rendering, verified metric definitions, and intuitive visual UX.
Sub-3s Visual Render Latency
Optimizing DAX measures and composite models so interactive dashboard pages render within 3 seconds.
100% Mobile & Tablet Responsiveness
Custom mobile layouts tailored for executive smartphone consumption on the go.
Strict Row-Level Security (RLS)
Guaranteeing users only see data corresponding to their assigned territory, department, or client account.
Verified Single Source Metric Calculations
Zero discrepancy policy between financial accounting systems and operational BI dashboards.

Automated Data Refresh SLA
Scheduled data gateway syncs delivering up-to-date business metrics ahead of morning executive standups.
Accessible Visual Palette
Color-blind friendly design systems avoiding misleading 3D charts or visual chart clutter.
Featured Business Intelligence Case Study
Deploying enterprise Power BI analytics across 18 business units for a manufacturing conglomerate.
Global Supply Chain & Sales Power BI Suite for Manufacturer
Designed and rolled out an enterprise Power BI reporting suite across 18 global manufacturing locations. Consolidated inventory, supplier logistics, and sales pipeline metrics into real-time interactive dashboards with automated mobile alerts.
Why Partner With Render Infotech?
Over 16+ years and 500+ successful deployments, we have established an engineering reputation in Bangalore for technical rigor, architectural transparency, and zero compromise on code quality.
- Dedicated In-House Engineers: Direct communication with senior specialists, not junior offshore intermediaries.
- 100% IP & Code Ownership: Full source code, database structures, and copyright ownership transferred upon milestone sign-off.
- Performance SLA Guarantee: Contractually committed speed benchmarks, security verification, and high-availability SLAs.
- Transparent Weekly Sprints: Live staging environments, progress demos, and clear milestone accounting.
Enterprise Performance Commitment
Every project we engineer is guaranteed to pass rigorous vulnerability scans, mobile responsiveness checks, and automated regression testing prior to production launch.
Bangalore Engineering Center
Kalyan Nagar, Bengaluru — Local Support & Global Standards
Data Analytics & Enterprise BI Services FAQs
Answers to common technical, pricing, and timeline questions regarding our Data Analytics & Enterprise BI Services services.
Ready to Architect Your Solution?
Connect directly with our senior technical architects in Bangalore for an architectural consultation, technology recommendation, and formal scope estimate within 24 hours.
Request a Data Analytics & Enterprise BI Services Proposal
Fill out your technical brief below to receive an architectural estimate within 24 hours.